Content
- QRS complex
- Formation
- Clinical significance
- Components
- ECG analysis
- Normal ECG
- Examples of the QRS complex shape
- QRS video
For the diagnosis and prevention of cardiovascular pathologies, an ECG is prescribed. Explanation of examination results provides for the analysis of the QRS complex, presented on the electrocardiographic tape by a combination of peaks and intervals. It reflects the cycles of excitation and recovery of the ventricles with the atria.
QRS complex
In assessing the functional state of the cardiovascular mechanism, the degree of pathological changes, the nature hemodynamic or innervation deviations, electrocardiographic examination.
The rhythm recording obtained as a result of the procedure is a graphically visualized volumetric projection information about the electrochemical processes observed on the surface of the organ. The key part of the diagnostic information is the QRS complex.
The cardiologist begins the analysis of the electrocardiogram by examining the teeth, intervals, amplitudes and their compliance with the established reference values. This is the central and most prominent area of the typeface. It represents the main surge in the biological activity of the organ.
The QRS complex of the ECG reflects the cyclical propagation of waves of innervating excitation (depolarization), followed by periods of recovery (repolarization). They correspond to the phases of contraction and relaxation of the ventricular sections, contractions of the central heart muscle.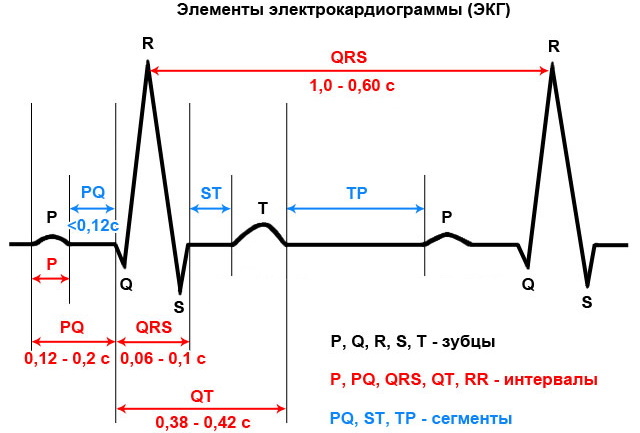
The jagged complex on the electrocardiographic recording looks like a combination of peaked peaks directed up (positive) and oriented with apex down (negative). The width of the graphical interval between bursts gives information about the duration of nervous excitement.
Formation
The mechanism of electrical conductivity of the heart is based on the passage of innervating impulses generated by the sinus node of the organ. The signal crosses the right atrium on its way to the atrioventricular plexus. Normally, the interval time of the QRS complex depolarization is in the range of 80-110 ms. The right and left ventricular sections in a healthy state of the organ are activated synchronously.
The innervating impulse passes through the bundle of His and Purkinje fibers, between which there is no clear border. The formation of a command to reduce leads to the appearance of the Q, R and S waves on the electrocardiographic recording, which are analyzed in combination. After the excitation of the ventricles, the last event of the physiological cycle occurs - repolarization. An electrical signal arises in the sinus (sinoatrial) node located in the right atrium.
The area is a collection of cells with a unique ability to generate spontaneous impulses that cause rhythmic contraction of the myocardium. The main function of these structures is to form an innervating signal and action potentials - a rapid change in membrane voltage.
The frequency of contractions of the heart muscle determines the rate of production of an innervating signal in the sinus node. The regulatory mechanism is realized through parasympathetic and sympathetic tissues. The former slow down the formation of the action potential, the latter accelerate it.
The QRS complex of the ECG reflects the current activity of the organ. Parasympathetic fibers originating in the brain release acetylcholine, a neurotransmitter that determines the heart rate. The biochemical component after the formation of the signal presented on the ECG in the form of negative and positive peaks at intervals, interacts with muscarinic receptors.
Clinical significance
Disturbances of nerve conduction in the structure of the heart organ lead to the appearance of stretched or reduced amplitudes between the teeth of the QRS complex on the electrocardiographic recording. His plexus block is expressed by an abnormal narrowing or excessive elongation of the R peak.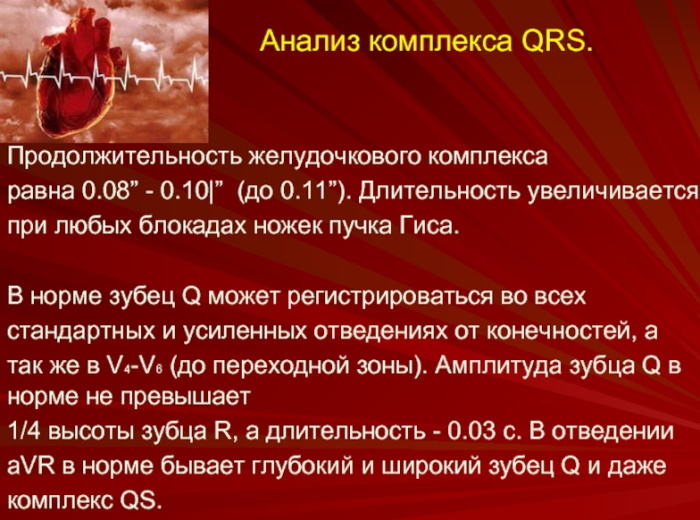
The complex assessment is used in diagnostics:
- arrhythmic dysfunctions;
- ventricular hypertrophy;
- blockade of an electrochemical impulse or ways of its propagation;
- myocardial infarction;
- electrolyte imbalance.
High-frequency analysis of depolarization is used to detect latent ischemic manifestations.
Clinical significance of the QRS complex:
- Sinus tachycardia. An increase in the frequency of contractions of the heart muscle exceeding 90 beats / min is not always a symptom of a cardiac disease. The temporary effect is caused by excessive physical activity, sports load or strong emotional excitement.
- Sinus node bradycardia. The clinical sign is associated with a slowdown in heart rhythms. In frequent cases, it develops against the background of a deficiency of the thyroid hormone produced by the thyroid gland.
- Respiratory arrhythmia. It is characterized by the dependence of the heart rate on the depth of inhalation or exhalation. It is considered not a pathological abnormality, but an individual physiological feature.
- Extrasystole. An arrhythmic disorder in which abnormal areas of the QRS complex suddenly appear in a normal ECG recording due to extraordinary contractions of the entire organ or an individual ventricle.
- Bigeminia. The alternation of normal contractile activity with foci of premature activity is detected by chance, since the violation is asymptomatic. On the ECG, it can be seen by QRS complex abnormalities.
- Trigeminia. An arrhythmic disorder in which a pair of normal contractions is followed by a pathological abnormality.
- Paroxysmal tachycardia. Functional impairment, on the electrocardiographic tape, determined by non-stop depolarization. Symptomatically manifests itself as uncomfortable sensations and arrhythmic tremors in the chest, ribs.
The clinical significance of the QRS complex lies in the accurate diagnosis of paroxysmal manifestations, alternating with long pauses in remission. The analysis of the teeth is used to identify preinfarction conditions, hidden lesions that conduct the innervating impulse of myocardial tissues, and inflammatory processes.
Components
Each tooth of the complex has its own diagnostic value. The first negative peak is the toothed element, denoted by the Latin letter Q.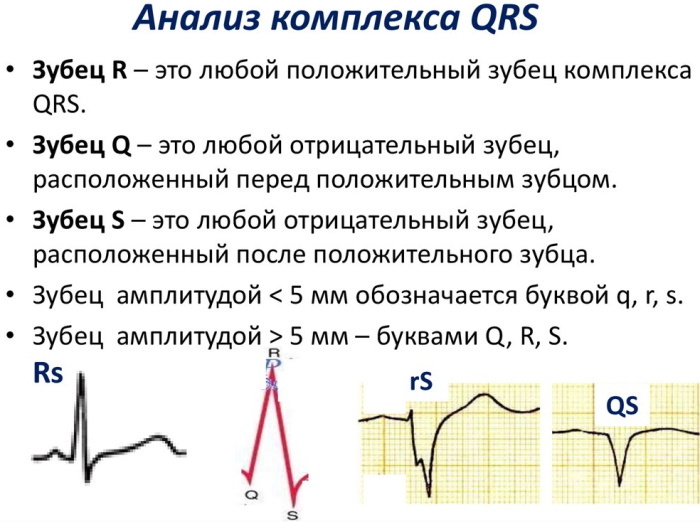
Its diagnostic characteristics:
- precedes peak R;
- reflects the excitation of the interventricular membrane;
- recorded with an interval length of up to 2 mm in left-sided chest leads I, aVL, V5, V6 in the form of the main vector of the electromotive force of the heart (EMF);
- manifests itself in lead III and disappears when recording a cardiogram after a deep breath of the patient.
An electrocardiographic lead is a scheme for installing diagnostic equipment electrodes recording heart impulses on the body. The main element of the complex is considered the R wave, which characterizes the depolarization of the ventricular divisions.
The amplitude of the peak in standard or amplified leads determines the position of the electrical axis of the organ under study. When registered with chest electrodes, it normally does not exceed 2.5 mV in height. An intermittent peak S reflects the terminal depolarization of the base of the left ventricular cavity. It looks like the deepest negative element on the electrocardiographic recording.
The duration and amplitude values for each tooth of the complex are shown in the table:
| Peak | Duration, sec | Length, mm |
| P | 0,7-0,12 | 0,5-2,5 |
| Q | 0,03 | 0,3-0,5 |
| R | Not rated separately | 10-19 |
| S | Analyzed as part of the S-T interval | 0,2-0,5 |
| T | 0,12-0,28 | Up to 25% of R wave height |
The QRS complex is essential in the prevention of myocardial infarction. A critical condition is characterized by necrotization of the tissues of the heart muscle. On the ECG, myocardial infarction reflects the expanded and deepened configuration of the S wave.
ECG analysis
Close attention is paid to the S-T segment, changes in which help to identify ischemia. With oxygen starvation of the organ, the area takes on a stretched appearance. The T-wave is normally straight, not serrated, with a shallow anterior part.
The temporal extent of the peak has no significant diagnostic value. The QRS complex contains the N and J points. The first one displays the transition from the isoline to the Q peak on the electrocardiographic recording, the second - from the S wave to the S-T section, which completes the cycle of contractions.
The width of the complex determines the duration of depolarization of the ventricular elements. Normally, it is 0.06-0.18 seconds. The width of the complex decreases as the heart rate increases.
The shape of the teeth is changed by extraordinary depolarizations characteristic of extrasystole. With blockade of the legs of the plexus of His, an expansion of the entire complex structure is observed. An increase in spacing is characteristic of some other conduction disorders.
Peak Q detection in chest leads V4-V6 indicates damage to the heart by a pathological process. Normally, the width of the tooth does not exceed 0.03 sec. The amplitude is 1/4 that of the peak R in the same lead.
The maximum height for this element is 0.2 mV. Normally, the Q wave has no barbs. The main peak in the analysis of the cardiogram is considered to be R, which reflects the periods of excitation of the cardiac ventricles.
In the interval of leads V1-V4 its amplitude increases. She starts sinking closer to V5 and V6. On the ECG, a decrease in the S peak in the V direction is noticeable1-V6. Sudden changes in individual values on the electrocardiographic record indicate mechanical or electrical disturbances in cardiac activity.
The conditions leading to this state are called alternation. It accompanies sinus tachycardia. A common cause of lengthening the Q-T interval, called the electrical systole of the ventricular elements, is hypocalcemia, contraction - in an overabundance of a trace element.
Normal ECG
A standard cardiographic record is formed by 12 electrodes that read electrical potentials in the leads - from the limbs, single and bipolar. The use of a millimeter grid allows you to accurately record intervals, peaks, and the work of individual morphological elements of the cardiac mechanism.
The QRS complex of the ECG reflects the nature of the contractions of more than 1 million. muscle fibers. Their activity causes the formation of an electromotive force, which the equipment translates into a graphic format. Normally, on a cardiographic recording in lead II, the zero or isoelectric line is first recorded.
It is followed by a miniature P peak with a short P-Q section. The ECG displays different measurements. Normal intervals are shown in the table.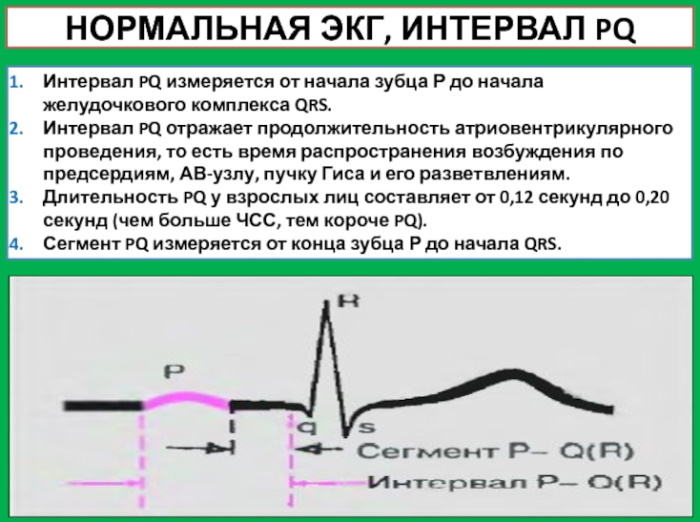
| Amplitude | Duration, sec |
| P-Q | 0,2-0,8 |
| P-R | 0,18-0,2 |
| Q-T | 0,38-0,55 |
| QRS | 0,06-0,10 |
| S-T | 0,35-0,44 |
On the electrocardiogram, in addition to the 5 main peaks at intervals, the U wave is often detected. Opinions differ as to its origin in scientific circles. Some researchers believe that it is formed as a result of repolarization of the papillary muscles or tissues of the Purkinje zone.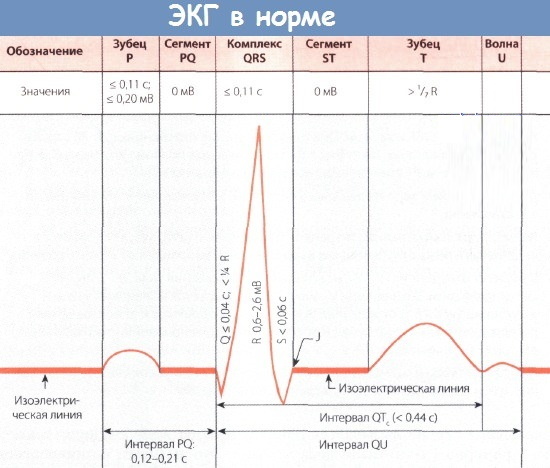
Other scientists associate its occurrence with the introduction of potassium ions into the cell membranes of the myocardium during diastolic contraction. The U wave has no diagnostic value. It is observed on a normal cardiogram and in patients with bradycardia.
Examples of the QRS complex shape
According to generally accepted practice, in the designation of teeth of a relatively small amplitude, lowercase letters are used, large ones - uppercase ones. Examples of the shape of the elements of the complex are reduced to the nature of the deviations.
Normally, the teeth have a pointed configuration with straight lateral lines and equal intervals when the patient is at rest. The height of the P peak is 0.2 mV, the width is 0.11.
Deviation from these parameters signals a hypertrophic state of the atria. Changes in the next P-Q interval indicate atrioventricular block, WPW, or LGL syndrome.
Q wave abnormalities, chipping, stretching, or narrowing are seen in patients with cardiomyopathy. Changes in the outline of the S peak are noted with bundle branch blockade, protrusion of the ventricular walls.
Deviation from the normal form of other elements of the QRS complex signals pericarditis, ischemia, and other disorders in the work of the cardiac mechanism. On the ECG, the syndrome of an extended Q-T interval is especially pronounced, which reflects a corresponding change in the normal configuration of the graphic outline.
QRS video
Wide QRS complexes: