
Content
- Chaddock ratio
- Correlation coefficients depending on the types of measuring scales
- What is the Chaddock Scale
- Data entry rules
- Correlation and determination indicators
- Average approximation error
- Negative values
- Video about the Chaddock-Snedecor scale
To assess the coefficient of linear correlation, its multiple index or to determine the statistical dependences of quantitative indicators on quality characteristics apply a scale Chaddock. It is conditional, but it is widely used in econometrics, in the construction of complex and multivariate mathematical models.
The Chaddock scale, as a qualitative statistical characteristic in technical and economic research, is successfully used in medicine, economics, marketing and sociology.
In practice, in medicine, the Chaddock scale is most often used when calculating mathematical statistics and calculating the probability of events. For example, in the study of the public health of the population or for an in-depth study of morbidity or mortality, depending on age and sex, from any disease.
Chaddock ratio
The basic scientific approach is the belief that no event happens by chance. Mathematical or statistical patterns are never considered in isolation, in isolation, regardless of influencing factors. Any event is a priori considered the result of the joint impact of many forces or circumstances.
For example, the level of sales in an average store is influenced by:
- retail space;
- illumination level;
- professionalism of personnel and managerial staff;
- showcase exposition of goods;
- additional services and services;
- purchasing power of the population;
- other hidden, implicit and non-obvious factors.
Another illustrative example is the number of children in a family.
It depends on:
- duration of married life;
- religious views of parents;
- material condition;
- social status;
- reproductive health;
- socio-cultural and ethnic characteristics.
The Chaddock scale (the correlation coefficient determines the dependencies in exact numerical terms) allows with mathematical reliably assess the level of influence of each factor separately, the degree of their joint impact on the studied indicator or event.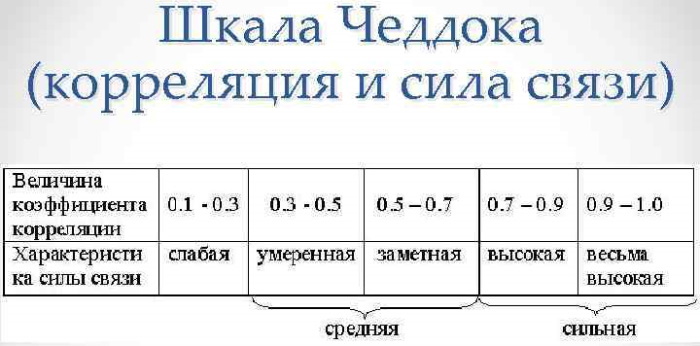
The ratio of effective indicators makes it possible to translate any numerical indicator or quantitative value into a qualitative parameter. The dependences of the Chaddock-Snedecor scale are shown in the table.
| Correlation coefficient | 0,1-0,3 | 0,4-0,5 | 0,6-0,7 | 0,8-0,9 | 0,91-0,99 |
| Communication characteristic | Insignificant | Moderate | Perceptible | High | Strong |
The mathematical relationship is used to build one- or multivariate linear models in statistical analysis. Such models make it possible to determine the presence of an interconnection of the variables, characteristics under consideration, the strength of influence or interconnection.
The Chaddock scale is used to accurately determine the covariance moment in probability theory, mathematical statistics, and the econometric sphere. The coefficient allows you to establish a linear, inverse or square dependence of random variables.
The method of processing large arrays of statistical data with an accurate determination of the tightness of the direct or feedback of various parameters is called correlation analysis. It cannot be done without the Chaddock-Snedecor relationship.
Correlation coefficients depending on the types of measuring scales
In the field of statistical analysis, special constant values are used that allow you to accurately establish the relationship between variables measured using different scales.
This is a kind of reduction to a common denominator. The Pearson association coefficient is applied to the x and y variables calculated on the dichotomous scale. If only one of the non-constants is dichotomous (binary), a point two-row correlation value is used.
Types of scales in which the Cheddock-Snedecor ratio is used:
- X-signs. It is a way of organizing variables in datasets, properties, values, and characteristics for various statistical observations - meteorological, medical, commodity and raw materials.
- Interval. Displays the difference between values that can be calculated, but these ratios are not statistically meaningful. The interval scale has the combined properties of the nominal and ordinal mathematical scheme. It is used to calculate the quantitative change in a feature or object over a given time interval. An example is the measurement of the temperature of sea water. In the morning it is + 19 ° С, by the evening it rises to + 24 ° С, that is, it becomes 1.26 times more.
- Ranked. They are used to classify signs, properties, events or objects according to the principle of "more-less", "warmer-colder", "higher-lower". When measuring in such a scale, the objects under study are assigned a numerical value in accordance with the severity of the calculated property. It is determined using the Chaddock-Snedecor ratio.
- Nominal. Contains exclusively data that cannot be ordered. They do not perform arithmetic operations with them. Such a scale is used to sort the arrays of statistical data or objects by a common criterion. The bi-point correlation coefficient is applied to the values according to the Chaddock-Snedecor relationship.
For both dichotomous variables, a four-field relationship is used according to the scale on which the calculations were made. The nonlinear interconnection of the studied objects makes the introduction of a correlation dependence meaningless.
What is the Chaddock Scale
Analytical grouping of quantitative data, qualitative characteristics or studied properties of objects allows you to plot the empirical relationship between several variables.
The Chaddock scale displays the correlation coefficient in numerical terms. If it is equal to or greater than 0.7313, the influence of the factor or the relationship of properties is considered high. The scale is used when calculating the regressive (inverse) ratio of indicators.
The geometric meaning of the correlation coefficient demonstrates the difference in the angle of inclination and the trajectory of the x and y axes when graphically displaying the dependence. A linear relationship indicates the presence of a direct relationship between variables or their mutual influence.
It takes a value from -1 to +1. The first indicator means a regressive relationship, the second - a direct one. The Chaddock scale is the ratio between random factors or variables that allows you to translate the qualitative characteristics of objects into a relatively accurate numerical value.
In the field of statistical analysis, the calculation of the multiple correlation coefficient has a special meaning. It reflects the tightness of a direct or linear relationship of the main variable with several influencing factors considered in the aggregate.
The multiple correlation coefficient, determined using the Chaddock-Snedecor scale, makes it possible to bring the effective signs and factorial ones to a single denominator.
To calculate the residual total sum of squares of errors or deviations, use the formula ∑ (yi-yx)2. The construction of regression mathematical models with calculations on the Chaddock scale is relevant when creating predictive systems.
They take into account only the permissible values of factor signs or independent variables. The Chaddock-Snedecor formula predicts the Y value for any deviation of the X line in the relationship plot.
When predicting the average annual level of sales of a certain product or calculating the economic indicators of an enterprise for reporting period, you can calculate the correspondence of the variables y and x at any time interval with a graphical representation dependencies.
Data entry rules
Values are grouped according to general characteristics or the statistical array is sorted according to one attribute in a nominal scale. The rules for data entry differ depending on the model being built, the mathematical system used, and the processing method.
For formulaic, tabular and graphical representations, the principles of filling in with information are different. Data grouping rules facilitate aggregation.
When sorting binary populations, the numerical values are classified to account for each value simultaneously in both intervals. They are placed at the intersection of the corresponding rows and columns.
Rules for grouping data for use in calculations on the Chaddock-Snedecor scale:
- Find a suitable range for each variable.
- Apply the found indicators to the corresponding coordinate axes of the graphical display.
- Draw connecting and leading lines from each point to create a working coordinate grid.
- Place each pair of related variables in the corresponding cell of the correlation field, assigning a checkmark indicating the properties.
- Sum values in rows and columns for marginal calculations.
It is easier to enter values into formula and tabular correlation systems than into graphical ones. You just need to substitute the required coefficient from the above scale of dependencies.
Correlation and determination indicators
The Chaddock-Snedecor ratio is used in the analysis of statistical data arrays, in the study of the practical significance of influencing factors or properties of objects. It is used to build synthesized models to predict event probability.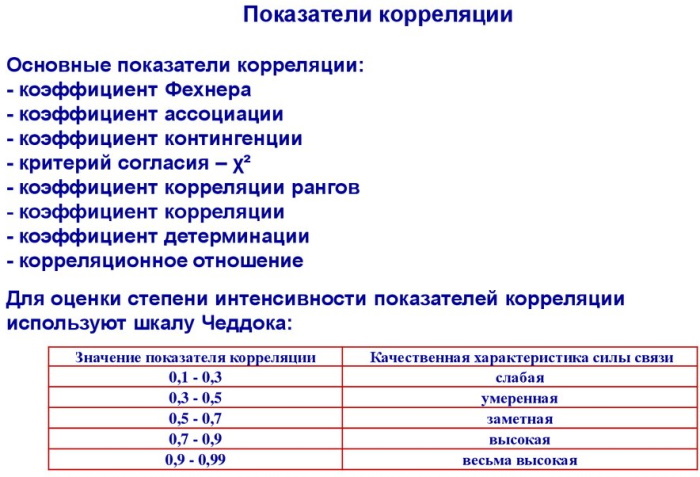
The Chaddock scale allows you to qualitatively assess the tightness of communication or the mutual influence of variables. The binary correlation coefficient is of particular importance in regressive calculations of the degree of inverse effect of the effective features on the subject of research.
In such calculations, one cannot do without an additional indicator. In this capacity, the coefficient of determination is introduced into the formula, which is always equal to the square of the correlation indicator. The additional parameter is written unchanged R2.
The indicator of determination in mathematical models is a fraction of the variance - the range of possible scatter of the numerical values of a random variable relative to the computational expectation.
The coefficient of determination is obtained from the known value of the correlation indicator, fitted on the Chaddock-Snedecor scale. The quantity is considered as a universal formula measure of the dependence of one random variable on a number of others.
A special case of the indicator of determination is the ratio R2 linear, binary or multiple correlation coefficient of the dependent object to factor values.
This formula is valid only for models with a known constant value of the effective indicator. When calculating binary feedback (regression), the value of the square of the correlation indicator, called the determination index, ranges from -1 to +1.
To calculate paired regression with a constant, use the general formula SStot= SSreg+ SSres. Based on the results of the calculations, a conclusion is made about the strength of the connection or the mutual influence of the factors under study.
The indicator of determination demonstrates the numerical value of the proportion of variation in the resultant attribute of an object or event. When interpreting the value R2 the correlation coefficient is presented in percentage terms.
For example, 0.8472 = 0.7174 means that in 71.74% of cases, when the factor indicator changes, the effective sign acquires the corresponding value. The equation is distinguished by high accuracy with the correct selection of values on the Chaddock-Snedecor scale.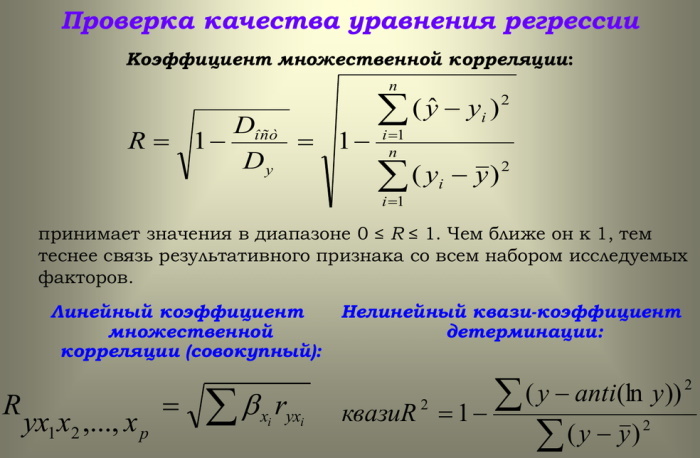
The remaining 28.26% of the determination indicator is accounted for by factors unaccounted for in the model. In the absence of a noticeable statistical relationship between the correlation coefficients of the variables, to calculate the asymptotic distribution, use the equation x2 (K-1), where K is the number of influencing factors.
Average approximation error
In sociological research, medical statistics, econometrics, the values of the force of mutual influence or the degree of stability of dependencies is often calculated using the replacement of objects with related and simplified.
This method of scientific research is called approximation. It allows you to study quantitative characteristics, qualitative properties, factor signs with greater accuracy and a lower level of error.
In number theory, using approximation, Diophantine approximations are investigated. In geometry, the replacement method is used when considering intersecting broken curves. In the econometric discipline, calculations using the mean error of approximation are common.
This is the name of the range of deviations of the calculated values of the dependent variable from the actual value. The method is of particular importance in linear binary regression equations.
The qualitative characteristics of the resulting or influencing factor in different mathematical models are estimated using the average or absolute approximation error.
The value not exceeding 5-7% of the error indicates the correct selection of the ratio of the equation with the initial data. If the average approximation error is outside the specified range, the formula is not used for statistical calculations.
Chaddock scale (correlation coefficient deviating by less than 1% from 1.00 indicates a stable functional connections of objects, events or properties) allows you to bring the volume of the population closer to the actual value of the effective sign.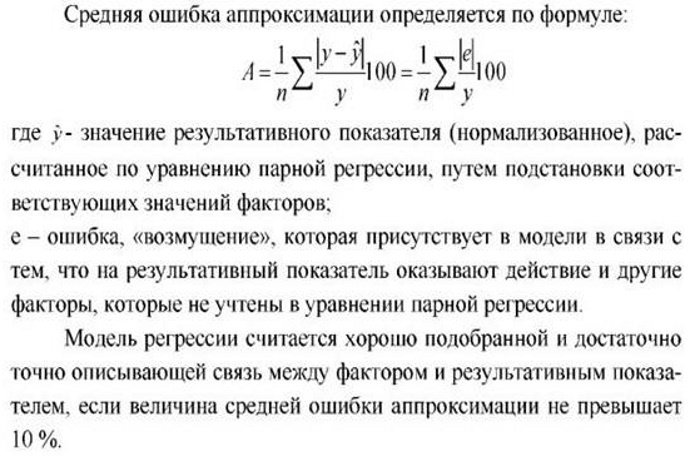
The indicator always differs from the theoretical value calculated using the pairwise regression equation. In rare cases, the approximation error is initially zero. The acceptable margin of error is 8-10%.
Negative values
Any calculated statistic with a correlation coefficient is subjected to a mathematical plausibility test. A set of observations or arrays of heterogeneous data represents a certain sample, in which there are errors.
Therefore, such calculations are perceived not as an absolute truth, but as a relatively accurate assessment of influencing factors, the qualitative characteristics of objects, the degree of connection of factors.
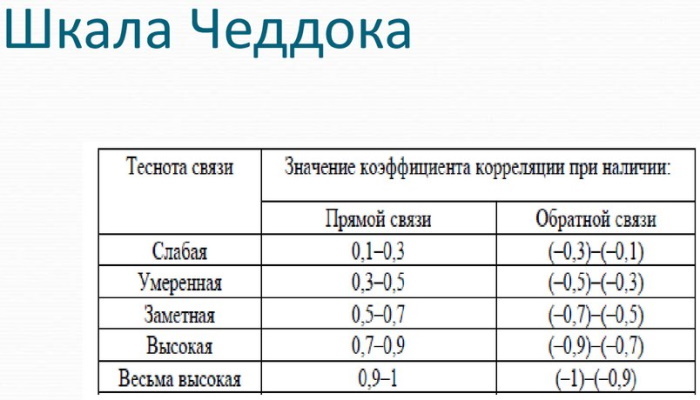
Negative values when calculated using the Chaddock scale are typical for regression models, the purpose of which is to establish feedback between research objects in an accurate digital expression. The correlation coefficient in such equations can take values from -1 to 0.
Video about the Chaddock-Snedecor scale
Correlation coefficient: